Australia’s business count grew by 85,130 over the 2025/26 financial year to 2,814,778, a 3.1 per cent rise and the strongest result of the past four years. New entries reached 460,461 against 375,331 exits, and the exit rate eased to 13.8 per cent, its lowest level over the period. Since June 2022, the country has added 275,054 businesses, an increase of 10.8 per cent.
Headline growth only tells part of the story for commercial property. Of the 85,130 additional businesses, 83,105 were non-employing, many of them sole traders working from home or on the road with little need for commercial premises. The more important shift for landlords is among employing businesses, which grew by 2,025 after falling by a combined 24,118 over the previous three years. Every employing size band increased. Businesses with 20 to 199 staff added 468 after slipping in 2024/25, and the number of employers shrinking back to non-employing status was the lowest in four years. More businesses holding onto staff means more businesses needing a place to put them.
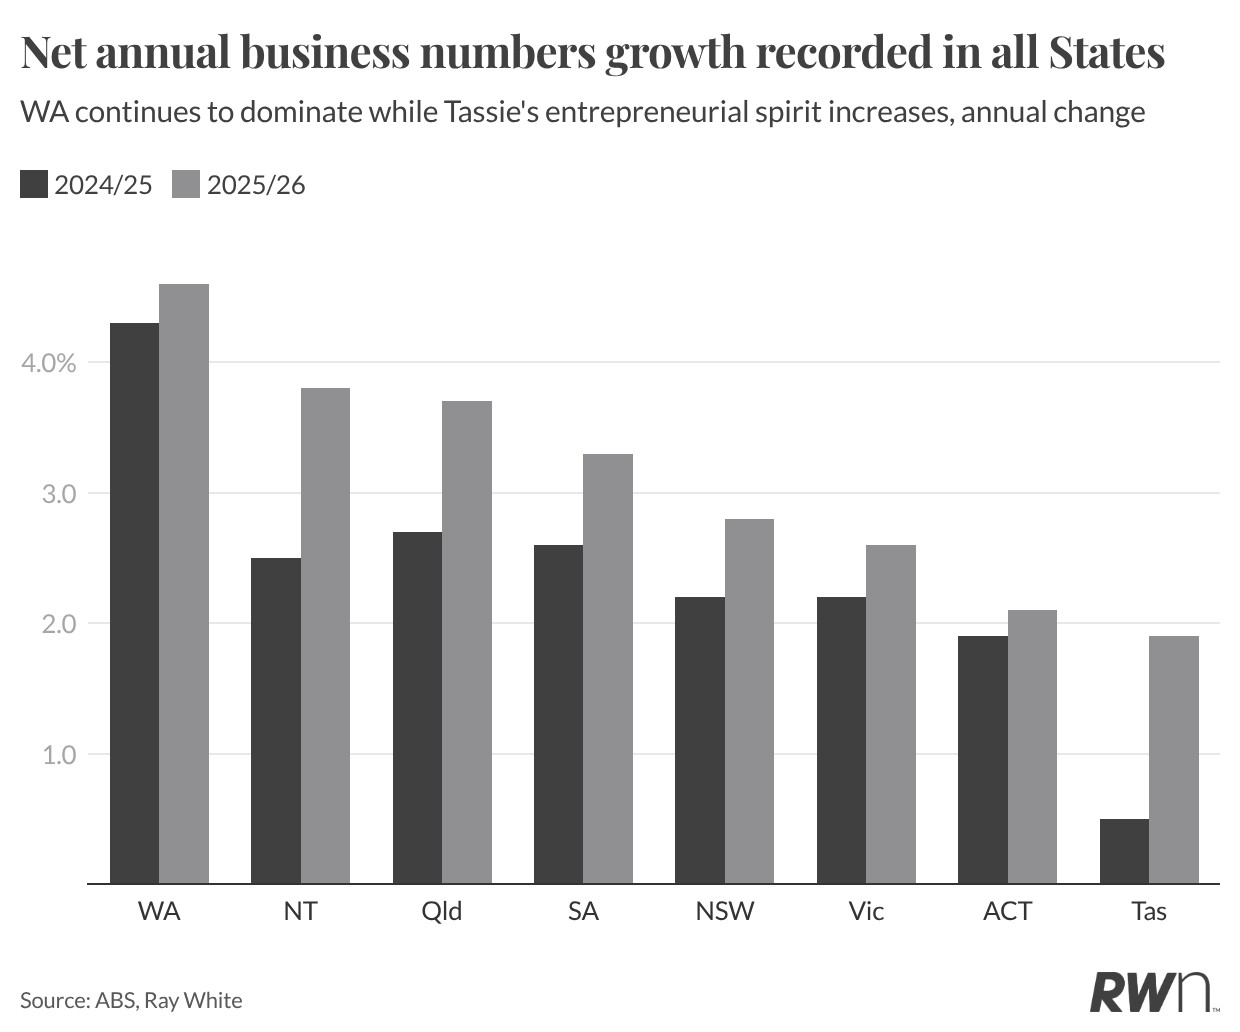
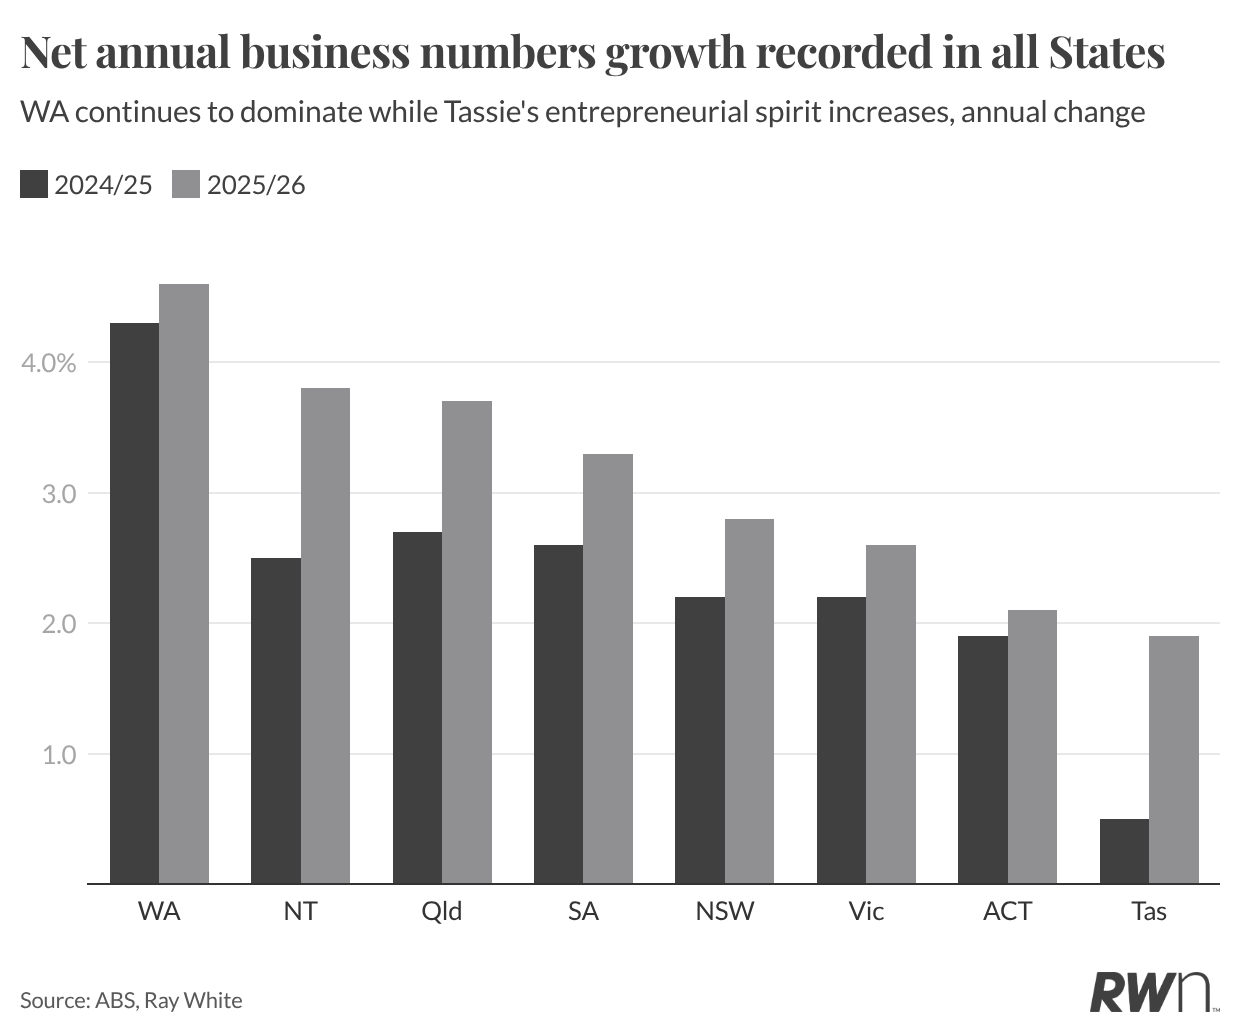
Growth picked up in every state and territory. Western Australia led for the second consecutive year, up 4.6 per cent to add 12,248 businesses, and has grown 16.1 per cent since June 2022, the most of any state. Furthermore, a net 453 existing businesses also relocated to WA over the year. This is translating into occupier demand, with Perth CBD office vacancy falling to 15.4 per cent and little new supply due over the next twelve months. Queensland’s increase of 19,244 was well above the 13,585 added a year earlier, and over four years the state has added more businesses than Victoria despite having around 230,000 fewer in total. New South Wales recorded the largest gain at 26,057.
South Australia recorded its strongest result in four years, up 3.3 per cent, and its businesses are among the longest-lasting in the country, second only to Tasmania on survival rates. Tasmania’s growth almost quadrupled from 0.5 per cent to 1.9 per cent, with the lowest exit rate nationally and the highest survival rates of any state. Even modest growth in long-term occupiers adds pressure on available office and industrial space. Canberra added 789 businesses and has grown 11.8 per cent over four years, ahead of the national rate. This private sector growth runs against government tenants consolidating, and it is more likely to fill smaller backfill vacancies.
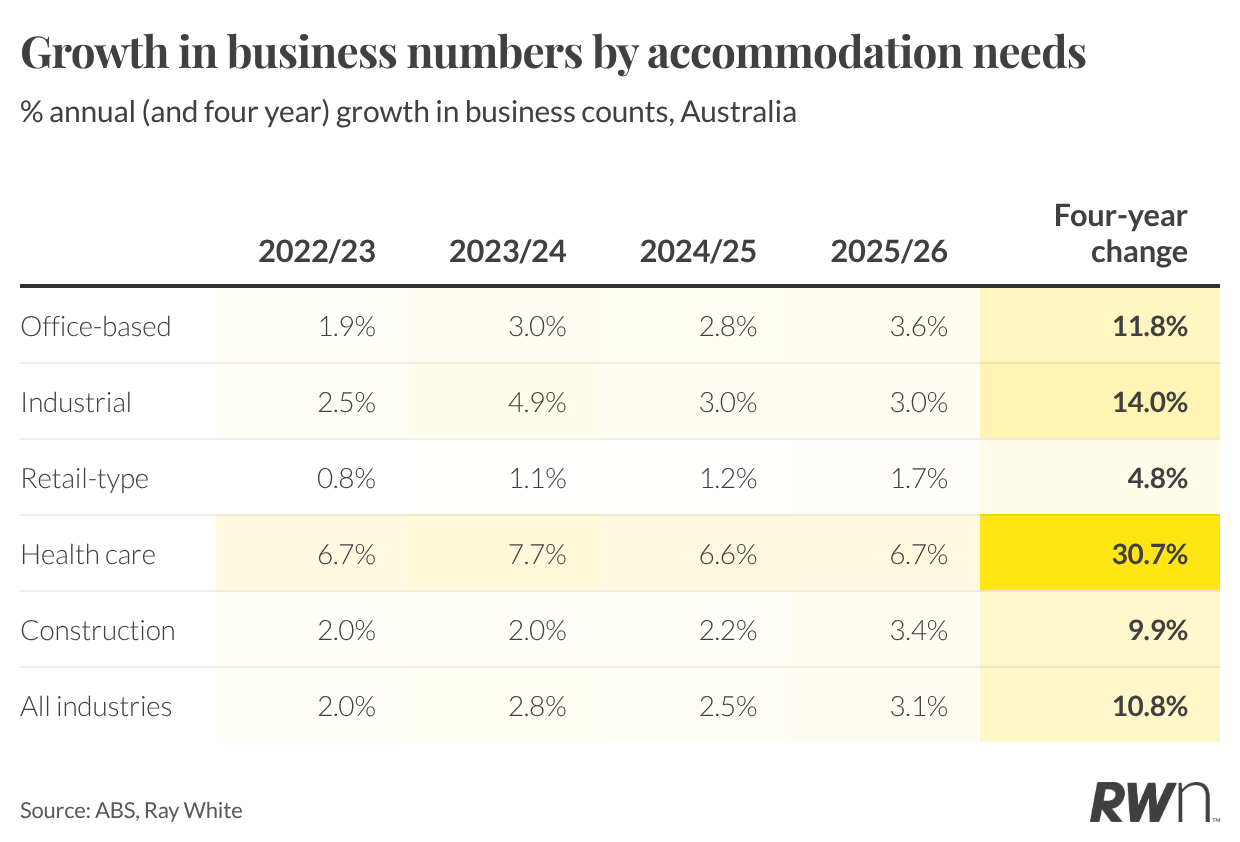
Office-based industries are where the strongest case for new demand sits. Professional services, finance and insurance, real estate, information media, administrative services and public administration together added 34,502 businesses, up 3.6 per cent and the fastest rate in four years. Finance and insurance grew 4.3 per cent, real estate 3.7 per cent and professional services 3.6 per cent, with information media and telecommunications posting its best year of the period at 4.0 per cent. Much of this activity is small in scale, which favours smaller suites, strata offices and metropolitan locations as much as CBD towers.
Industrial demand is more mixed than the figures first suggest. Transport, postal and warehousing added 12,127 businesses and has grown 24.5 per cent in four years, yet it also has the highest churn of any industry. Only 37.4 per cent of businesses that entered in 2022/23 were still operating by June 2026, the lowest survival rate across all industries, which points to delivery and rideshare drivers rather than operators taking warehouse space. Traditional shed occupiers barely moved, with manufacturing up 0.2 per cent and wholesale trade up 0.5 per cent. Construction recorded the largest gain of any industry at 15,603, supporting ongoing demand for small industrial units, factory and storage premises and hardstand.
Retail trade businesses increased by just 125, the first rise in four years, and remain 1,178 below June 2022 levels. Retail property is instead being filled by services with health care and social assistance added 14,278 businesses, up 6.7 per cent, and has expanded by 30.7 per cent since June 2022, with one of the highest survival rates of any industry. Arts and recreation grew 3.8 per cent and other services, which includes personal services, rose 3.1 per cent. Medical, fitness and service tenants are now doing much of the leasing work traditional retailers once did.
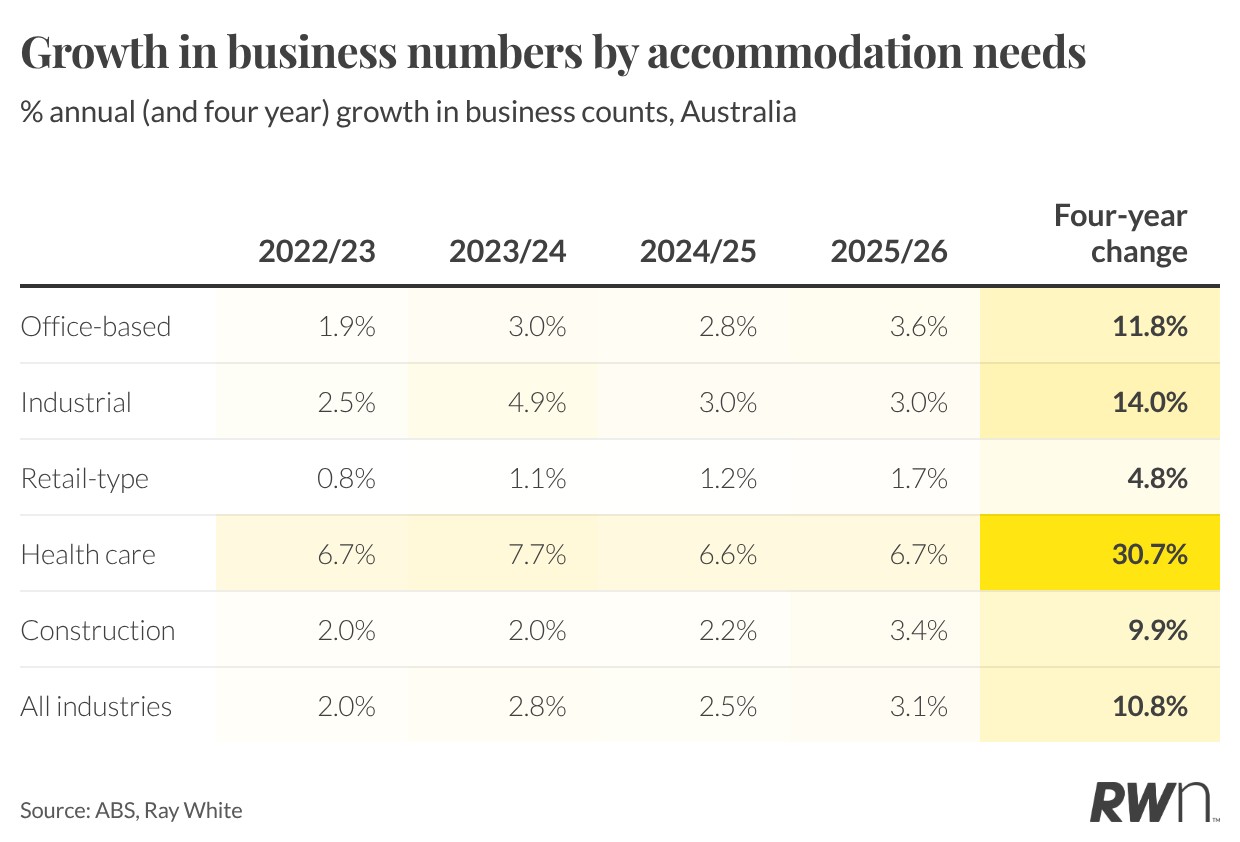
The 2025/26 result is the best of the past four years, and the return of employer growth gives it more weight for commercial property than headline numbers alone. Office-based industries and health care offer the clearest demand signal which is an encouraging sign after a tough few years. Industrial demand from new businesses is narrower than the transport figures imply and retail centres will continue to rely on services (including health) to fill space.
Vanessa Rader | Head of Research